
Black Friday and Cyber Monday / Interactive infographic
BFCM peak hour
infographic.
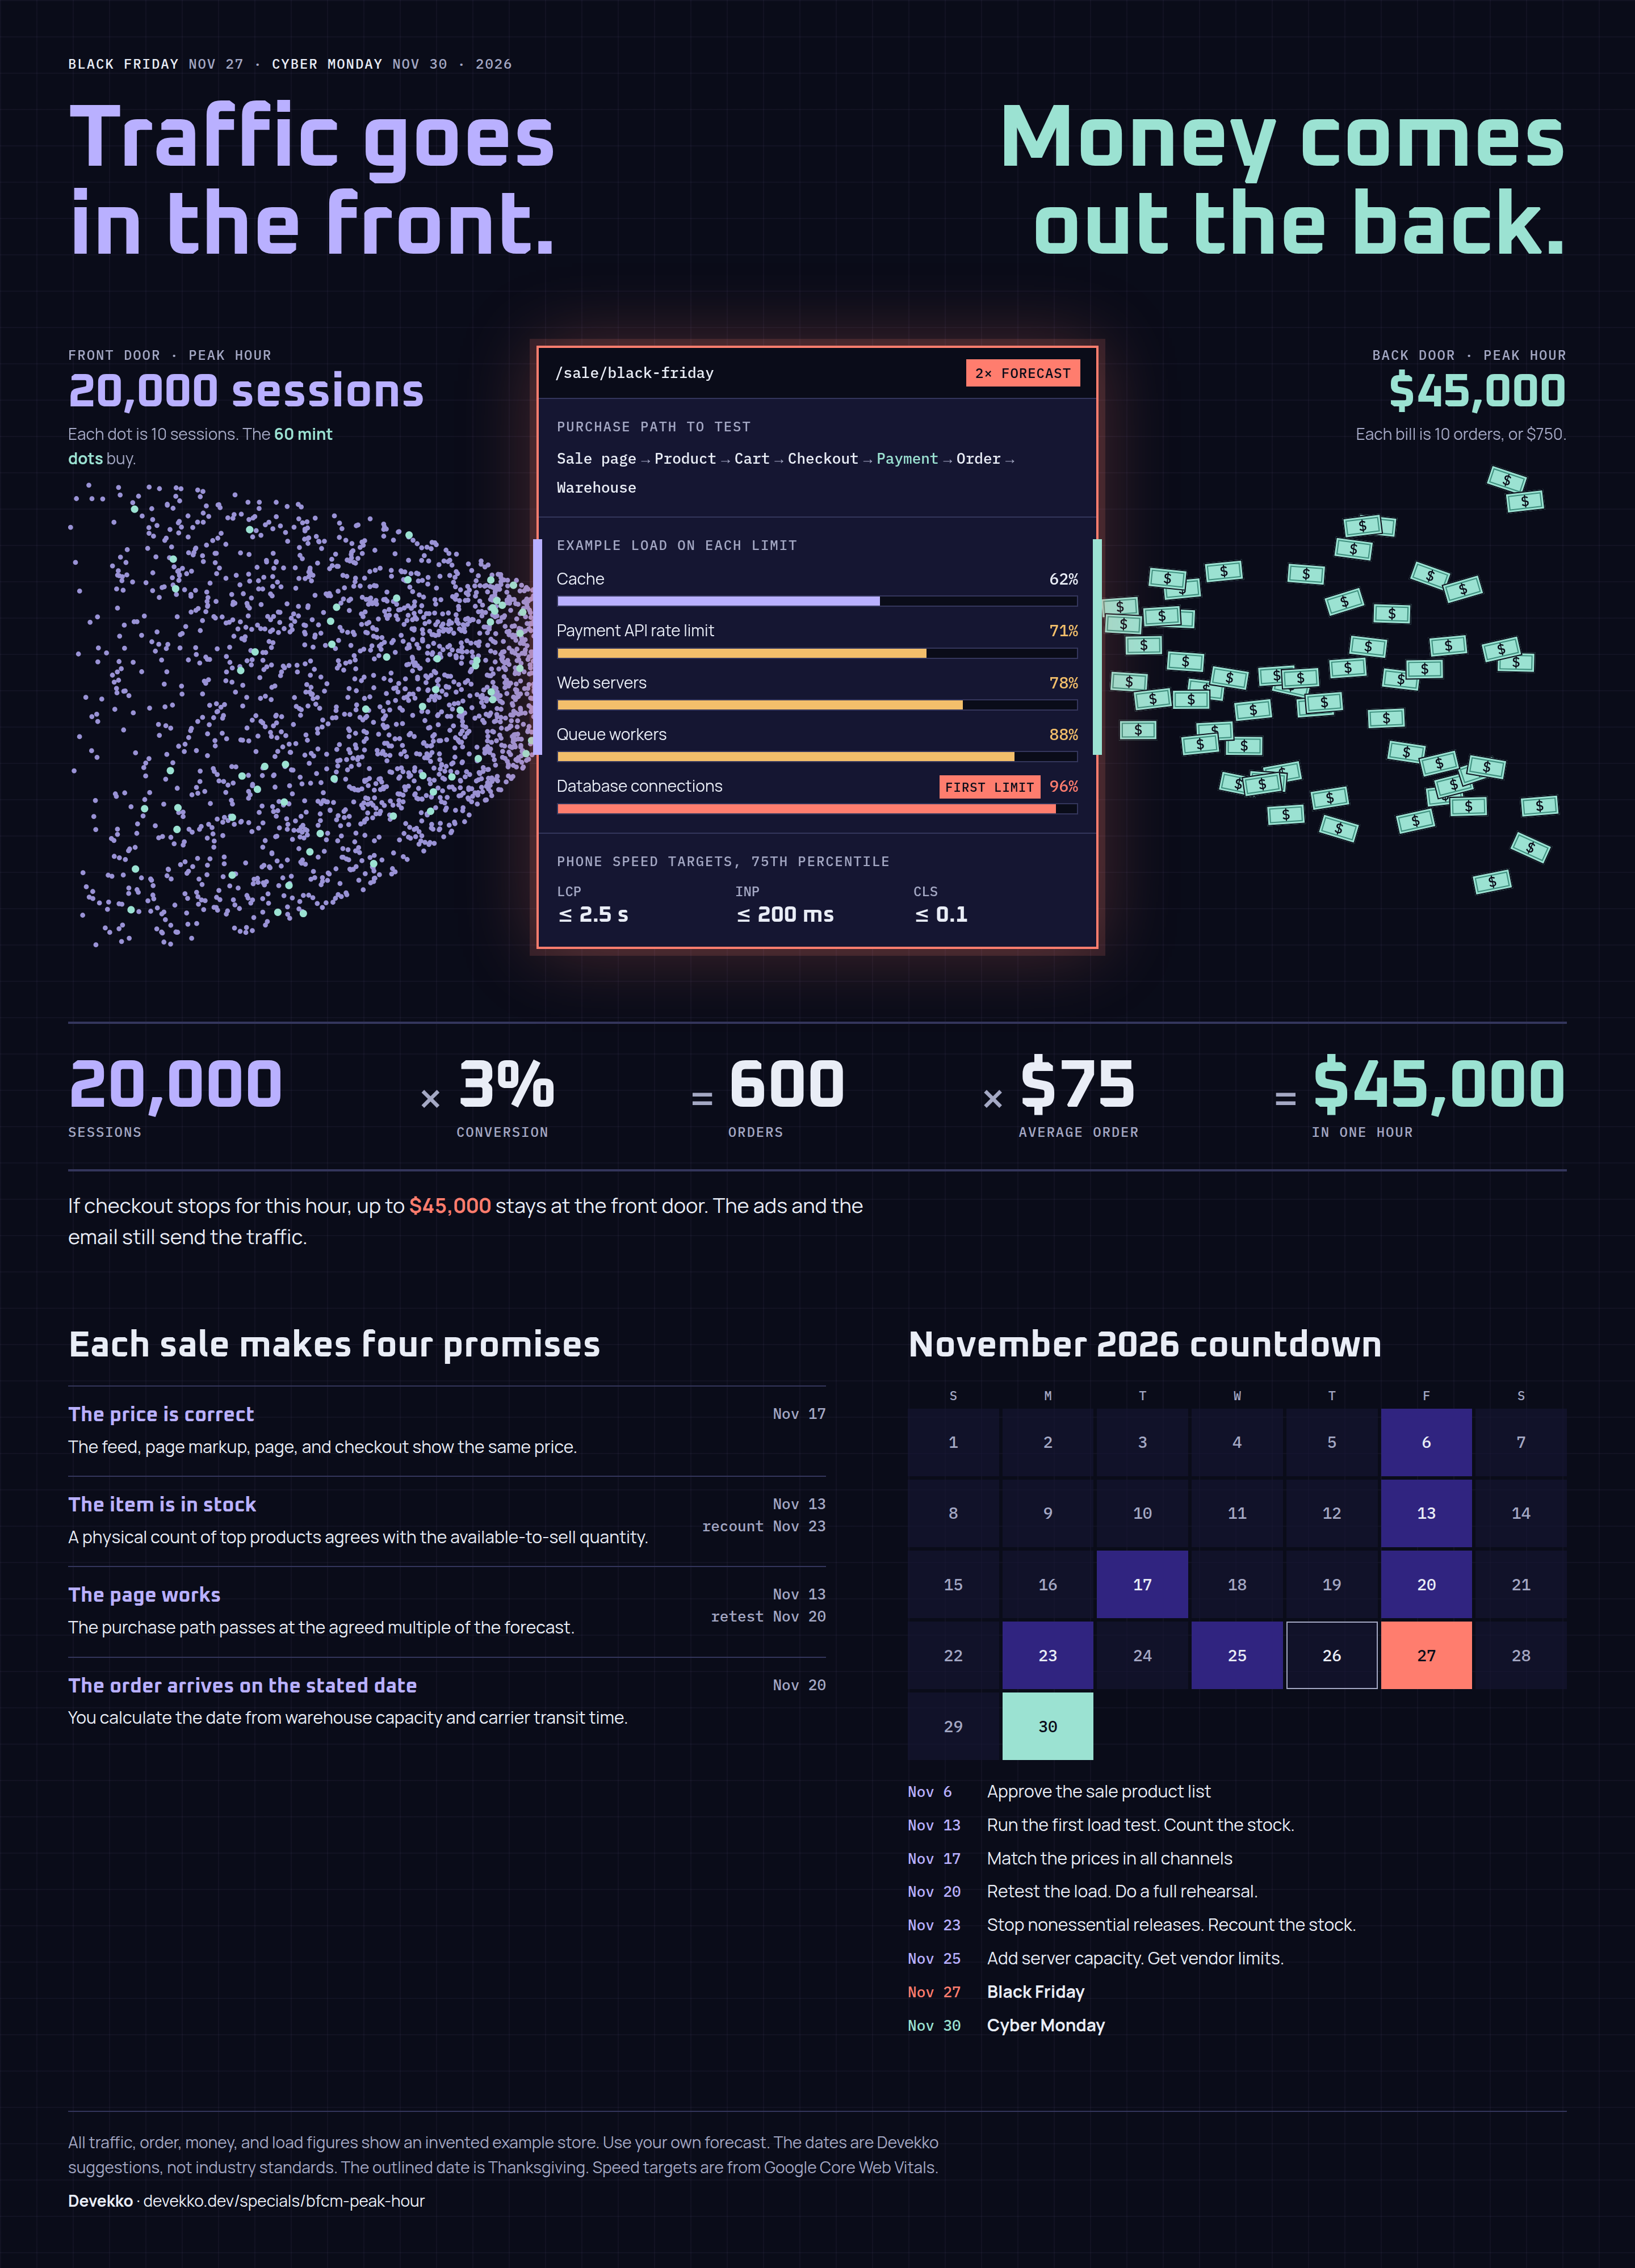
See how traffic at the front of an example store becomes money at the back, and which site limit stops it first.
Change the load
Choose the forecast or the 2× load test. The dots, bills, meters, and figures change with the load.
Black Friday Nov 27 · Cyber Monday Nov 30 · 2026
Traffic goes in the front. Money comes out the back.
/sale/black-friday
2× FORECAST
Purchase path to test
- Sale page
- Product
- Cart
- Checkout
- Payment
- Order
- Warehouse
Example load on each limit
Phone speed targets, 75th percentile
- LCP
- ≤ 2.5 s
- INP
- ≤ 200 ms
- CLS
- ≤ 0.1
20,000sessions
×3%conversion
=600orders
×$75average order
=$45,000in one hour
If checkout stops for this hour, up to $45,000 stays at the front door. The ads and the email still send the traffic.
Each sale makes four promises
- The price is correct
The feed, page markup, page, and checkout show the same price.
- The item is in stock
A physical count of top products agrees with the available-to-sell quantity.
- The page works
The purchase path passes at the agreed multiple of the forecast.
- The order arrives on the stated date
You calculate the date from warehouse capacity and carrier transit time.
November 2026 countdown
- Approve the sale product list
- Run the first load test. Count the stock.
- Match the prices in all channels
- Retest the load. Do a full rehearsal.
- Stop nonessential releases. Recount the stock.
- Add server capacity. Get vendor limits.
- Black Friday
- Cyber Monday